Monitor, Verify and Trust.

Windsor Office
logo
Call Us
  • 1-970-686-2189

  • info@dpdiagnostics.com

Location Pin
  • Windsor, Colorado

  • United States

Working Hours
  • 08:00AM - 05:00PM

  • Monday to Friday

  • +1(123) 456 567

  • support@copious.com

  • Manhattan Hall,

  • Copious Melbourne, New Yourk

  • 08:00 - 16:30

  • Monday to Saturday

  • +1(123) 456 567

  • support@copious.com

  • Manhattan Hall,

  • Copious Melbourne, New Yourk

  • 08:00AM - 05:00PM

  • Monday to Saturday

UK Central Acquisition Terminal Service

A primary use of flow meter verification systems (powered by diagnostic systems) is to assure the flow meter is operating correctly. Use of a verification systems facilitate ‘Condition Based Maintenance’ (‘CBM’) instead of expensive, time consuming, hazardous ‘Routine Scheduled Maintenance’ (‘RSM’). CBM reduces both maintenance cost and staff exposure to hazardous areas.
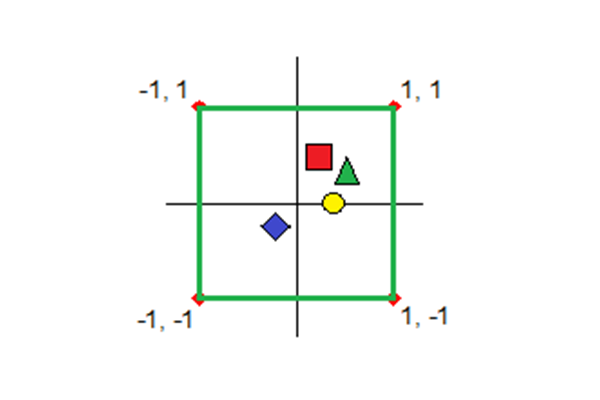
Prognosis was tested at the UK Central Acquisition Terminal Service (‘CATS’) in Teesside, England. The UK regulator attended. The meter was a 16”, 0.6β orifice meter. Initial results showed the meter to be operating correctly (see Figure 1). The metering staff then deliberately induced various orifice meter problems.

image

Fig 1. Correctly Operating Meter.

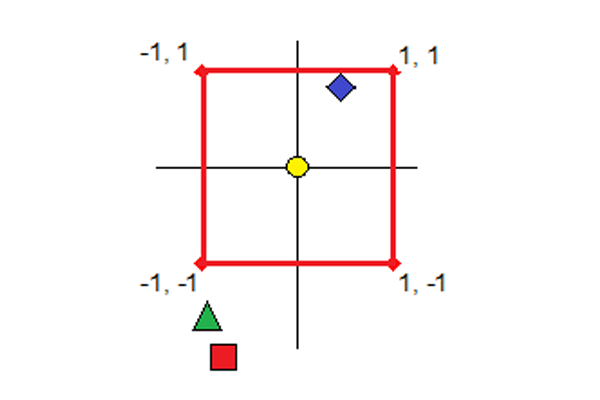
Figure 2 shows the result of keypad entry geometry error, where the orifice bore of 8.195” was erroneously entered as 8.295” inducing a +2.8” flow prediction bias.

image
image

Fig 2. Orifce bore Keypad Entry of 8.295” real 8.195“ (+2.8% flow bias)

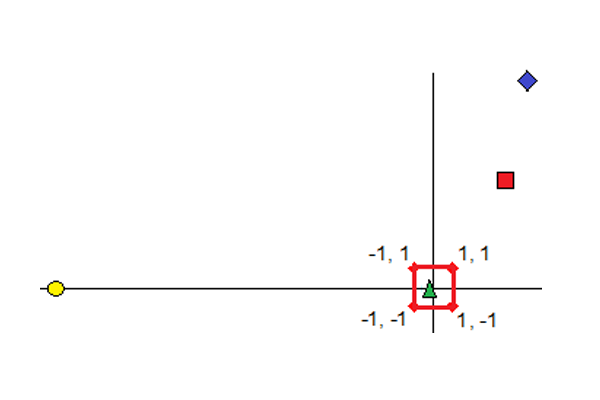
Figure 3 shows the result of the wrong DP transmitter in a stack (i.e. different ranged DP transmitters) being read. The correct primary DP of 17.5 kPa is read by thanover-ranged DP transmitter showing its maximum 15 kPa. The DP error indices a -7.1% flow prediction bias.

image
image

Fig 3. DPt 15kPa instead 17.5 kPa (-7.1% Flow Bias)

Figure 4 shows the result of the plate being installed backwards. As the plate has a bevel on the back face, this changes the meter performance. This induces a -15% flow prediction bias.

image
image

Figure 4. Plate is Installed Backwards (-15% Flow Bias)

Figure 5vshows the result of the plate sharp edge becoming worn. This changes the meter performance. The wear tested induced a -2% flow prediction bias.

image
image

Fig 5. Worn Orifice Plate Edge (-2% Bias)

In all cases tested, when the orifice meter was given a malfunction Prognosis showed something was wrong, and the pattern recognition gave a short list of possible malfunction sources that included the specific malfunction being tested.
The UK regulator OGA has subsequently agreed to the adoption of CBM at this terminal thereby potentially significantly reducing unnecessary maintenance costs.